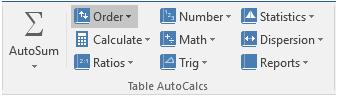
When you have a table in Word, PowerPoint or Outlook with numbers, you can select the table and carry out some calculations on it such as Sum, Count, Standard deviation or Variance. This section of Numero is called Table AutoCalcs, and can found on the left hand side of the Numero tab. This is shown below:
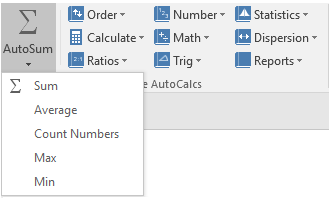
Autosum  can be found in the Numero ribbon in Word, PowerPoint or Outlook in the Table Autocalcs section. Its primary use is to calculate the sum of all the selected cells in a table and copy the result onto the clipboard. The accompanied dropdown menu below the icon has additional functions such as Average Count the cells that contain number and finding the minimum and maximum of range of numbers in a table.
For example:
1. Calculate the weekly total using AutoSum
2. Calculate the average

3. Find the maximum
There are nine further subsections for table calculation enabling you to carry out simple calculations such as getting the sine, cosine or tangent of an array, to evaluating the geomean, harmean or the variance. These functions are divided into nine subsections, shown below:
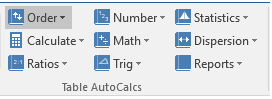
The table below contains details of the functions in each subsection. Information on the function can be found here.
| Subsection |
Functions |
| Order |
SORT(a), SORTD(a), REVERSE(a), RANDOMIZE(a), RANK(a;1), RANKAVG(a;1), NORMR(a), NORM(a) |
| Calculate |
SUML(a), AVGL(a), MINL(a), MAXL(a), DIFF(a), DIFFN(a), DIFFF(a), DIFFL(a), SUMD(a), AVGD(a), MIND(a), MAXD(a) |
| Ratio |
SUMX(a), SUMP(a), SUMLX(a), SUMLP(a), SUMDX(a), SUMDP(a), DIFFSUMX(a), DIFFSUMP(a) |
| Number |
ROUND(a;0), ROUNDUP(a;0), ROUNDDOWN(a;0), TRUNC(a;0), ABS(a), NEG(a), INT(a) |
| Math |
EXP(a), LOG(a), LN(a), LOG2(a), SQRT(a), CBRT(a), PRODUCT(a), FACT(a) |
| Trig |
RADIANS(a), DEGREES(a), SIN(a), COS(a), TAN(a), COSEC(a), SEC(a), COTAN(a), ARCSIN(a), ARCCOS(a), ARCTAN(a), SIND(a), COSD(a), TAND(a), COSECD(a), SECD(a), COTAND(a), ARCIND(a), ARCCOSD(a), ARCTAND(a) |
| Statistics |
MEDIAN(a), MEAN(a), MODMEAN(a), IQM(a), GEOMEAN(a), HARMEAN(a), QUADMEAN(a), CUBMEAN(a), VARP(a), VARS(a), SDEVP(a), SDEVS(a), SUMABS(a), SUMSQ(a), DEVSQ(a), ABSDEV(a), AVEDEV(a), MAD(a) |
| Dispersion |
RANGE(a), MIDRANGE(a), Q1(a), Q2(a), Q3(a), IQR(a), FENCEL(a), FENCEU(a), OUTLIERS(a), BOXMIN(a), BOXMAX(a), MIDHINGE(a), TRIMEAN(a), D1(a), D9(a) |
| Reports |
FREQUENCY(a), REP(a), REPFIVE(a), REPSEVEN(a), REPBOWLEY(a), REPSTATP(a), REPSTATS(a), REPBOX(a) |
Examples:
1. Sort the following array of numbers in order from smallest to largest
2. Round the following array of numbesr to zero decimal places
3. Return the natural logarithm for the following array of numbers
4. Return the arithmetic mean for the following array of numbers
6. Return the results for the functions: SUM, AVERAGE, COUNT, MAX, MIN